
How would you like to utilize your reports dashboard to effectively map out the progression of your business?
Your QuickBooks POS dashboard is more than simply for adding and removing reports or changing the layout.
Allow it to become a powerful tool for your business to stir a desire for growth as well as watch and monitor your QuickBooks POS productivity.
- Under Reports, select the Dashboard in the drop down
- In this window, you can either select Customize Dashboard or Get Started Now
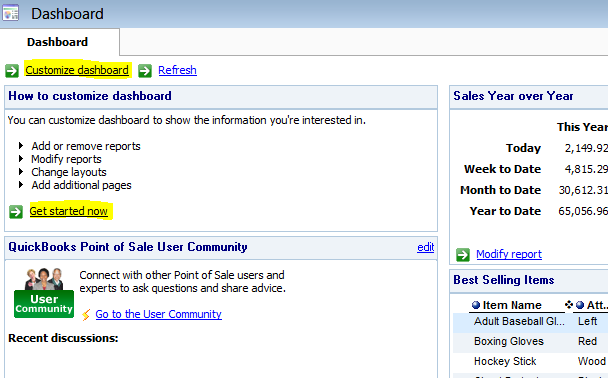
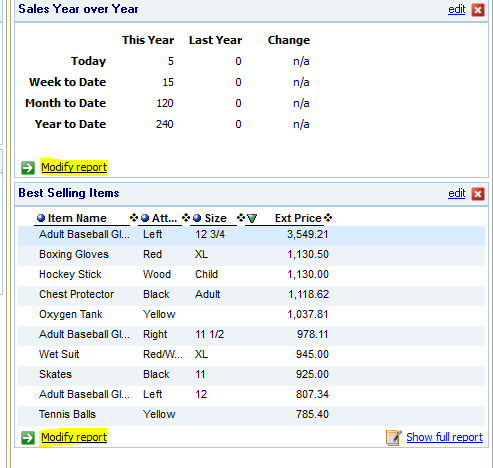
- Here in QuickBooks POS, you can modify your Sales Year Over Year to show Number of Transactions, Dollars Sold or Number of Units. Simply select Modify Report in your Sales Year Over Year box to the right, or the Best Selling Items box below.
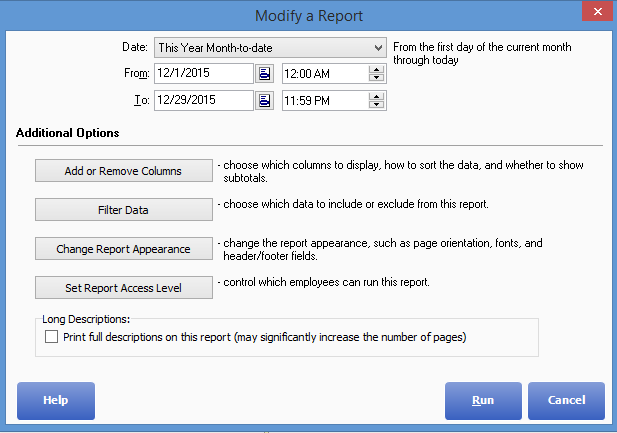
- Here, you can Set Report Access Level to set which employees are allowed to run the QuickBooks POS report, or if you want to maintain sole access as the owner.
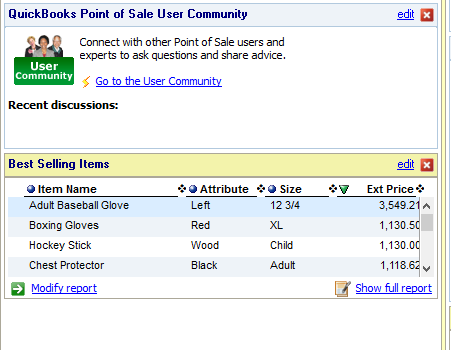
- In the Best Selling Items, you can not only select the time frame in which you desire your report to show, but you can also filter specific data, such as Vendor, Department, Promo Code,etc. Here, you can also change the overall appearance of your QuickBooks POS report by selecting Change Report Appearance.
- You can also personalize your QuickBooks POS report with things such as Best Selling Items, Department Sales Graph, Employee Commissions, and many more. Look to the left of the QuickBooks POS Dashboard page to find some of these helpful items for your own preferences.
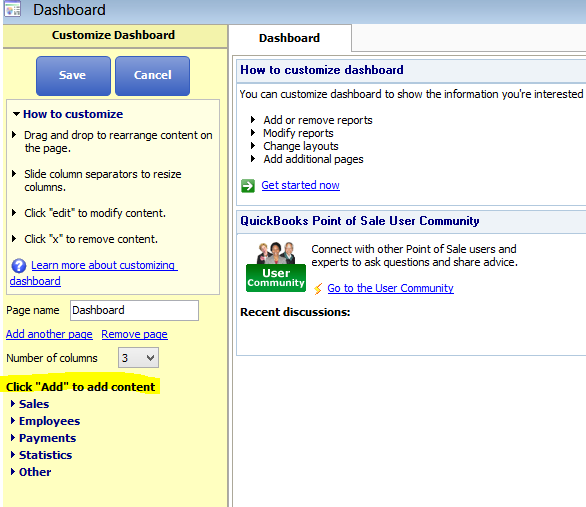
- For example, if I want my report to express my best selling item, I simply click on Sales, and next to Best Selling Item, I click Add. You will see my new window giving me my best sold items directly below the QuickBooks POS User Community window.
- After you’ve found the selected fields in which you wish to incorporate into your report, make sure to save your changes, and watch the changes become applicable before your eyes!