
We’re going to do a brief run through on all of the categories and types of report under the Report Menu. So let’s go ahead and start with it.
- Sale:
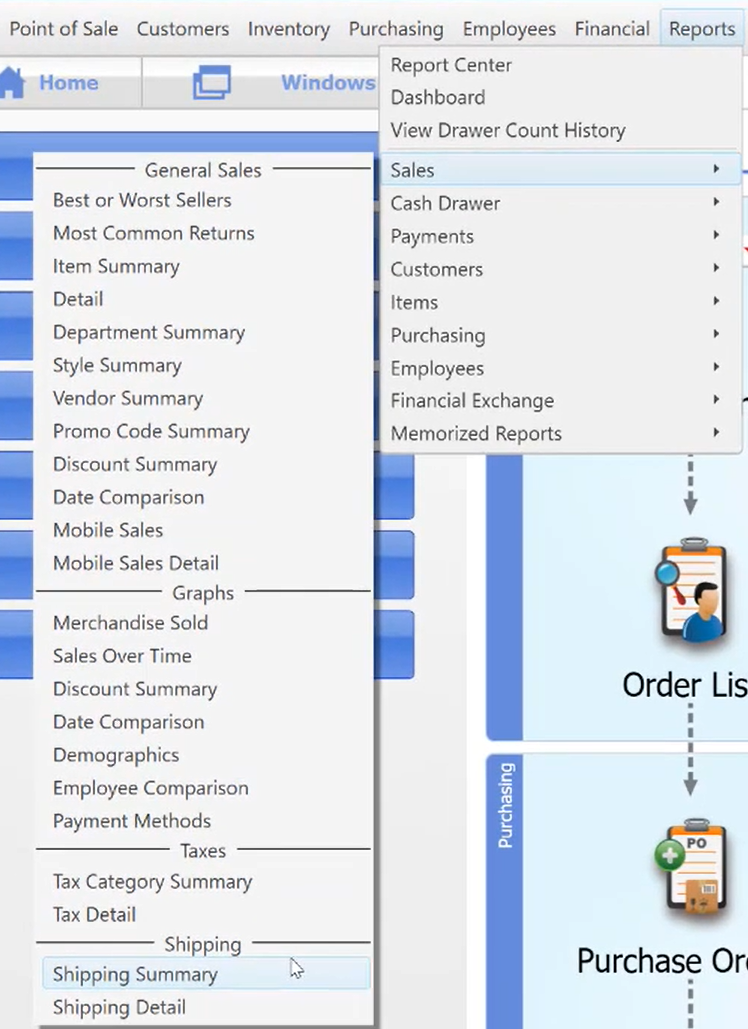
- General Sales
- Best or Worst Sellers – These are the reports for the products you should order more of and the products you should probably stop ordering because they’re not selling at all right now.
- Most Common Returns – This is going to give you a little view on which products you have in your store that people mostly return. Maybe it breaks or maybe it’s often defective and people have to bring it back because it wasn’t what it should be, you’re either are going to talk to your vendors about those products or you’re going to find a new vendor with a better quality product.
- Item Summary – This is going to list item by item and just give a total for each item.
- Detail – This is going to have all your different sales and you can expand them and look at all the items and it’s going to be really detailed on all of your sales.
- Department Summary – This will help you see the totals per department. Department Summary of sales can give you a great report on total quantities and total dollars sold in each department. It also provides the margin and most profitable departments.
- Style Summary – Styles can be a cross hatching of color and size. So the Style Summary will help you see which size and color of a product is selling the best. Therefore, when you go back to ordering, you’re going to want to order more of the sizes that you’re selling all the time.
- Vendor Summary – This very much like department summary, it is going to help you know who are the best vendors. You can determine vendors who sell a lot and who gives the best margin that you can work with.
- Promo Code Summary – This will help you when you’re handing out flyers or people come to you from Facebook and you want to note that in the promo code. It shows where your marketing budget or your marketing dollars are going the farthest where the most people are coming from if you are recording promo codes discount.
- Discount Summary – This is going to show you how much money you’ve discounted off for different discount codes. It helps you track why you’re giving discounts and also track discount codes that are being used too often for certain reasons.
- Date Comparison – This where you can compare dates about your sales.
- Mobile Sales and Mobile Sales Detail – It is all about reports regarding your Mobile Sales may it be items that you’re selling from go payment app in mobile.
- Graphs – This usually covers all topics similar to General Sales but in a Visual Form.
- Taxes – It shows reports of the taxes you owe. This can be elaborated more in QuickBooks Accounting.
- Shipping – This where you can check your recorded shipping costs when you are shipping out products.
- General Sales
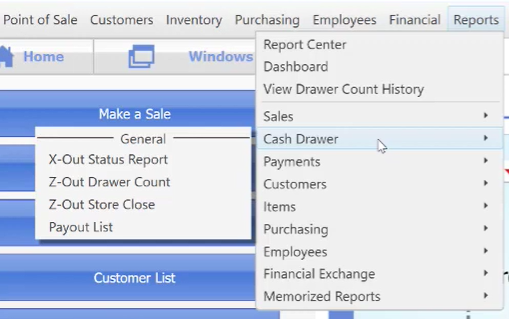
- Cash Drawer – Shows reports that you do at the end of the day and even though they say “Z-Out” or “X-Out” in point of sale. They really are just a report, they’re not actually zeroing anything out so you can just take a look at how you did on any certain day according to your payments in your cash drawer. If you do payouts to vendors from your cash drawer you can also take a look what payouts happened.
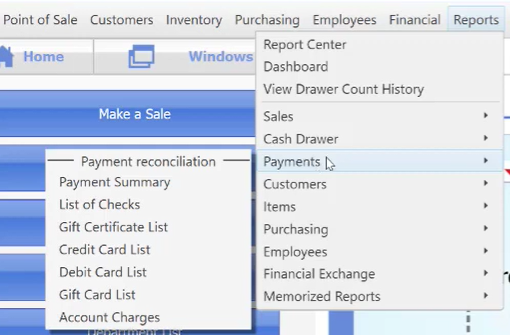
- Payments – This will be all about the button that you hit on the “Make a Sale” screen to take a payment. You can look at certain lists for the different types of payments and how you are taking payments, lists of checks and payment summary.
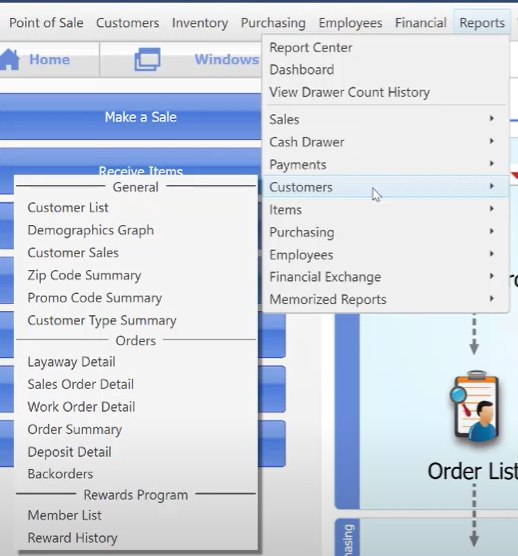
- Customers – This is where you can look up customers in different ways. (Recommended: To record all of your customers’ names and email for marketing purposes)
- Some ways to look at is their buying habits, how often they come in, by their zip code.
- You can also look up your layaway orders, sales order and work orders if you are a company that does such things.
- Backorders is a good way to track what people are waiting for to come in and make sure you have ordered it and that it is coming in.
- For rewards, you can look who’s on the rewards members list. Reward history is going to tell you who has redeemed their rewards.
- Items
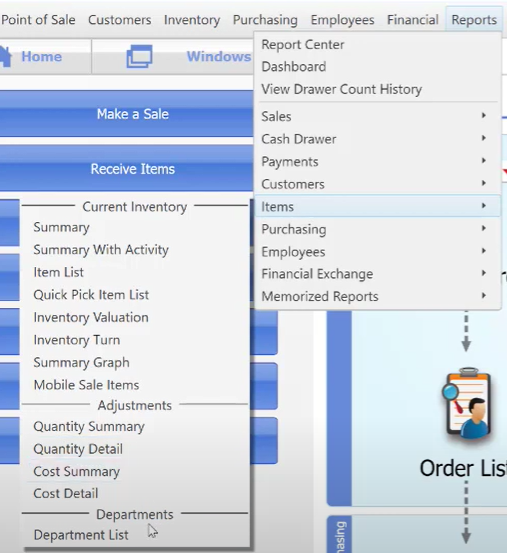
- This is like inventory, you can look at a summary or summary with activity to see your most active items that are coming and going all the time.
- Items list report is the best way if you’re wanting to make a report and narrow down on some specific criteria for items by using filters to narrow it down.
- Quick pick item list is an easy way to look at what’s on your quick pick buttons on the “Make a Sale” screen.
- Inventory turn is all about what inventory is turning over and values for that.
- You can also see the summary of current inventory in a graph.
- We’ve got adjustments for quantity and cost. These are just reports about those adjustments and what is being adjusted.
- Department List is a report that lists out what your departments are.
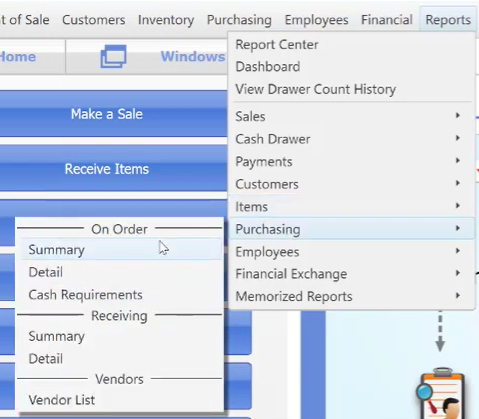
- Purchasing – This is going to show you what is on order and how much money you are going to be spending for what is on order. For the receiving, you can see what has been receive over a period of time, either the summary or detail on that.
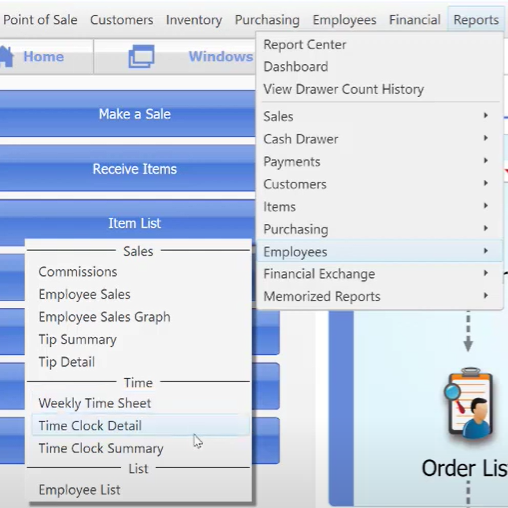
- Employees – This is the best way to give out commissions and tips. Also to monitor their time entries in order to do the payroll for your employees.
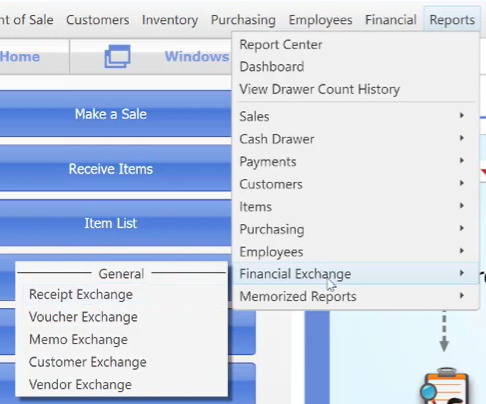
- Financial Exchange – This is going to be reports on what has been exchanged with QuickBooks Accounting.
- Memorized Reports – This is where your reports are going to be assigned if you make a specific report and save it or “Memorized” it.
