
Today where going to talk about extending your report in excel, to do some calculation in your department. Reports in QuickBooks POS don’t always have all the information that you want so sometimes you need to take the extra step of getting the data into Excel and doing some of your own calculations.
Let’s begin:
For example, I wanted to get a report that would actually show me how much profit I have on my store. So, let’s do this by department and I wanted to figure out what department I have the most profit.
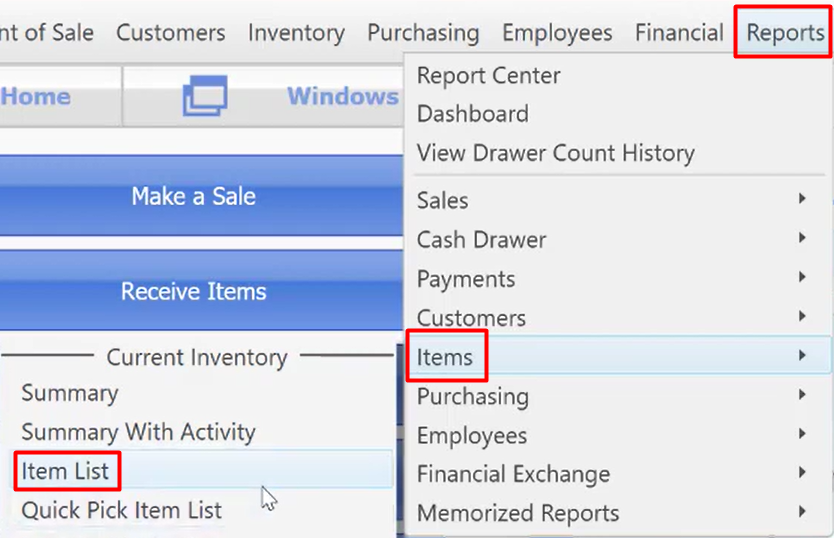
- Go to “Reports” menu then click “Items” and click “Item List”.
- This is your Item detail on your Reports.

- This is your Item detail on your Reports.
- Click “Modify”.

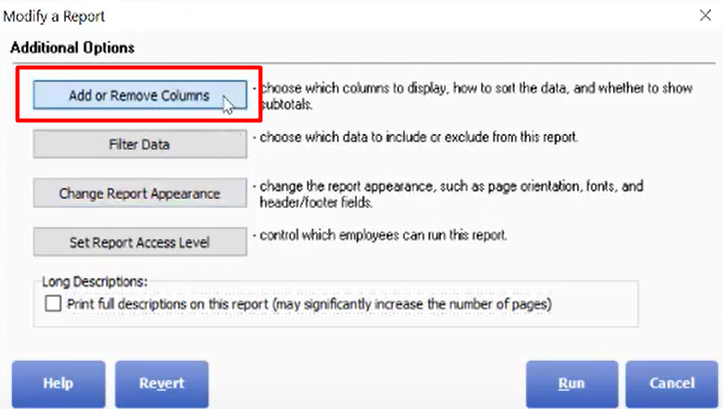
- In order for you to easily manage your item details report in Excel you can modify the columns on the important details of your items in your department. Click “Add or Remove columns”.
- Then check “Department”, “Item name”, “On-hand Quantity”, and “Margin” then click “Save”. This is we think the most important columns in your reports.

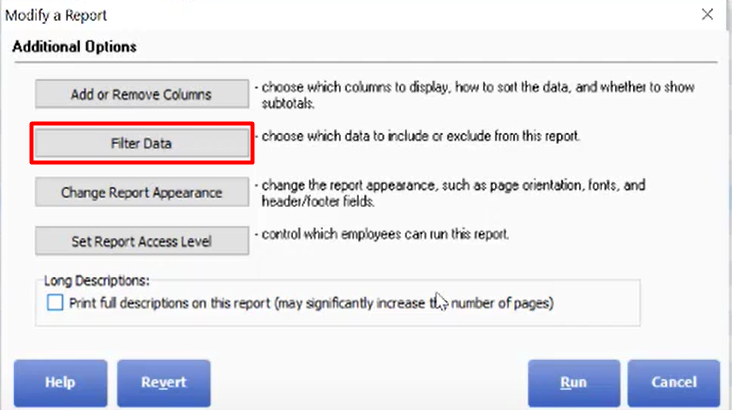
- Click “Filter Data”.
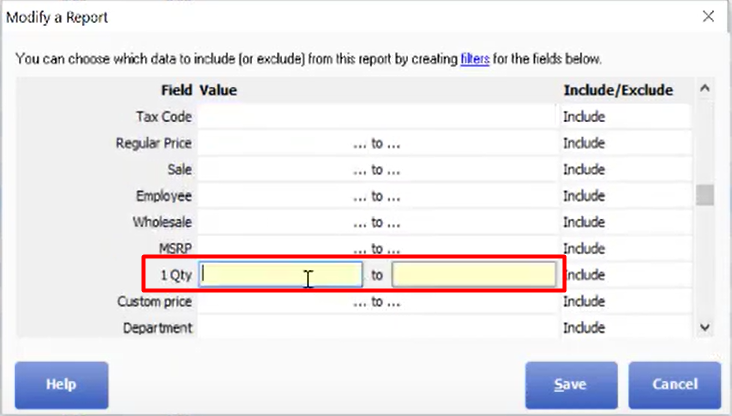
- Filter all the Zero’s in your reports so, go to “1 Quantity” then type “1” to “99999”. Then click “Save”.
- Then click “Run”.

- This is now our Item reports will look like.

- Then check “Department”, “Item name”, “On-hand Quantity”, and “Margin” then click “Save”. This is we think the most important columns in your reports.
- Let’s do some computation, click “Excel” on the menu bar.

- Now, on getting the product of “On-hand quantities” and “Margin” the formula is equal sign then click the on-hand quantities multiply it to the margin, which will be like this “=F7*H7” then “Enter”.

- Drag down to automatically get the product for each item.
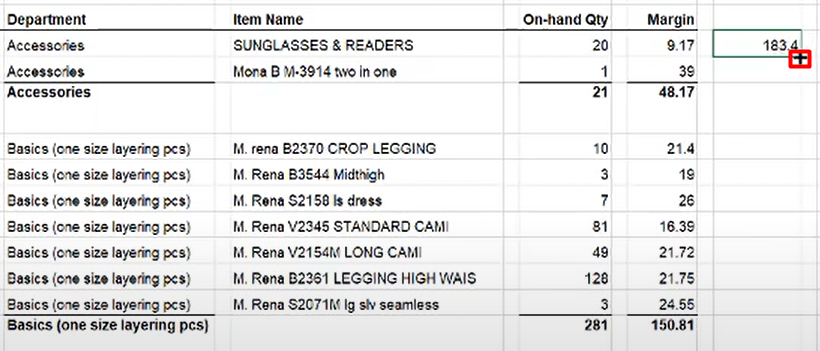
- If you want to get the total of the product you get from on-hand quantity and margin this is the formula “=SUM(drag the first product to the last product you want to add)”. Then click “Enter”.
